In the past few days I’ve put together an activity monitoring demo that will be used to explain the core concepts and give you an idea how SAM can be used to monitor activities of a particular domain.
Event streams
First of all, a good example needs constant event feeds. I was thinking about monitoring TCP packages on my box, but then came up with much more comprehensive example: Twitter feeds. Twitter has such a high volume of messages that it’s easy to derive event streams from it. In order for correlation to make sense we need events that share some kind of context. Using the twitter search API we can query messages that contain particular keywords, which is just enough contextual information for this example to make sense. Because I was tired of the king of pop, I decided on another high volume discussion, in this case iran.
You may ask: “Why event streams to begin with?” Because SAM is intended to monitor activities in a system close to real time. System activity is expressed a number of events that happen in no particular order but constantly over time. Event’s don’t even need to share the same properties, even though in our example they do.
And last but not least: It’s no fun to monitor a system without activity. You’d just get blank graphs and empty tables, which is hard to explain to the audience.

Correlation
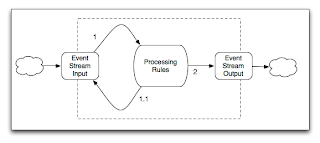
Events come in all kinds of flavors. Most likely events share common properties if they derive from the same domain, i.e the twitter message cloud. When instrumenting a target domain you create event representations and push them to SAM using a specific stream input. A stream input is bound to a transport layer (i.e. JMS) and has a set of processing rules associated with it. These rules are used to monitor and act upon event streams if certain conditions kick in:
rule "all iran tweets"
when
    $tweets: List() from accumulate(
      $t : Tweet(id>0) over window:time(15s) from entry-point "iran tweets",
      collectList( $t )
   )
then
   SAM.getListener("iran results").update($tweets);

end
In this example a simple rule is associated with the event stream input “iran tweets” that collects messages over a 15sec time window and pushes them to a stream output “iran results”.
While stream inputs collect events, stream outputs are used to forward events,
i.e. for notifying SLA watchdogs. The number of processing steps between input and output is not limited. You may use rules that trigger other rules. I.e. first filter certain events and then correlate them:

But for the sake of simplicity we simply collect events over time and push them to the monitoring UI. We could add more complex processing rules, but that would extend the scope of this blog post and will be explained in Part 2 of this series. But for those of you who cannot wait, I suggest to take a look at Drools Fusion, the CEP engine that drives the complex correlation capabilities within SAM.
Monitoring
The whole purpose of SAM is monitoring and management of a system in place. SAM has a close relation to BPM console, as it will be used to realize the BAM capabilities (Business Activity Monitoring) for JBoss BPM projects. For this reason I’ve chosen to implement the monitoring UI right atop of the BPM console framework. The user interface you see in the next sections is actually an editor component that can be plugged into the BPM console.
But before we dive into the details, we need explain how SAM interfaces with a monitoring console.
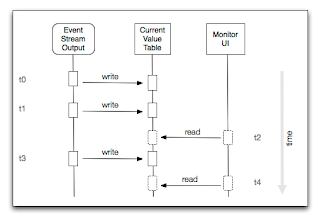
The monitoring UI and SAM are decoupled through the use of current value tables (CVT). A CVT holds the correlation results at a particular point in time. Any processing result that is forwarded to an event stream output will update a specific CVT that is associated that output. The monitoring UI doesn’t access the stream output directly, but instead reads the data from a CVT:

So, whats happening in our twitter example? Every 15 sec we collect the events from our stream input and simply forward to a stream output, that in our case is writing to a current value table. The monitoring UI runs in a another thread and uses a different update interval. It assembles a graphical representation and displays it to the user. In this case a line chart that depicts that number of messages at given point in time:

Et voila! We’ve reached our first milestone: Monitoring twitter participation on a certain topic close to real-time.
Analysis
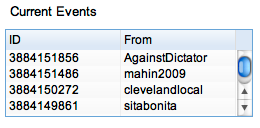
As the name suggests, a current value table only holds most recent data. In our example it means the last sample point on the x-axis of the chart above. Here’s the corresponding value table:

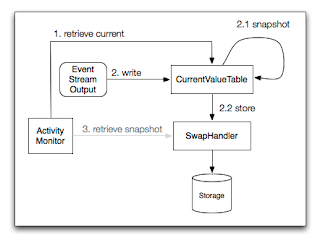
In this case four people have been tweeting about “iran” at that given point. But what if we want to go back in time? I.e. inspecting a previous peak or any other kind of derivation? Fortunately our CVT implementation doesn’t simply purge all records when an update occurs, but instead “swaps” all data to a Handler that will maintain a CVT’s history. It stores all snapshots so they can be retrieved later on.

Second milestone: We are not restricted to the most recent data, but can also go back in time and compare current and past event streams by simply navigating through the chart:

Drill down
That leaves us with one remaining question. The event properties available are pretty limited. Why is that? And how can we get to the details?
In order to answer these questions we need to step back a little. SAM tries to provide event stream analysis close to real time. That means we aim for minimum footprint whenever possible. Event representations travel back and forth through the whole monitoring infrastructure, beginning with the target domain being monitoring, then entering the event processor itself and finally being represented visually in a monitoring UI. It’s important to restrict the payload without sacrificing the analysis possibilities. The solution is simple: SAM works with references to both the target domain and the event entity. Basically everything that is required are an event context (i.e. twitter user name), a timestamp and a reference id (i.e. message id). Other properties that go beyond that depend on the correlation rules you want to apply. The challenge when creating a monitoring solution is finding the right balance between target domain instrumentation (initial event representation) and correlation capabilities.
If we stick to our example, both message ID and username are sufficient to drill down later on. We can always go back to twitter and retrieve the message contents for a particular message ID. It leverages one of the fundamental ideas behind SAM CVT implementation: On-demand content retrieval:

Putting it all together
Let us quickly recapture what has been explained here.
We capture events of a target domain and push them to SAM through event stream inputs. Each input is associated with a set of processing rules that monitor the event stream and kick in on certain conditions. When rules kick in we can forward events to stream outputs or further feed them into the processor.
One of the use cases for stream outputs are monitoring tools that display the information to a user. Users watch for exceptional situations and need to know what’s causing them. This also implies access to events that did happn in the past.
Thorough analysis requires you to drill down to the event details and the source of information. Which is not necessary for all events, but only those of interest hence the need for on-demand content retrieval.
Comments? Thoughts? Please let us know at the Overlord forums.
In the meantime enjoy the screencast of the twitter monitoring demo in action.
